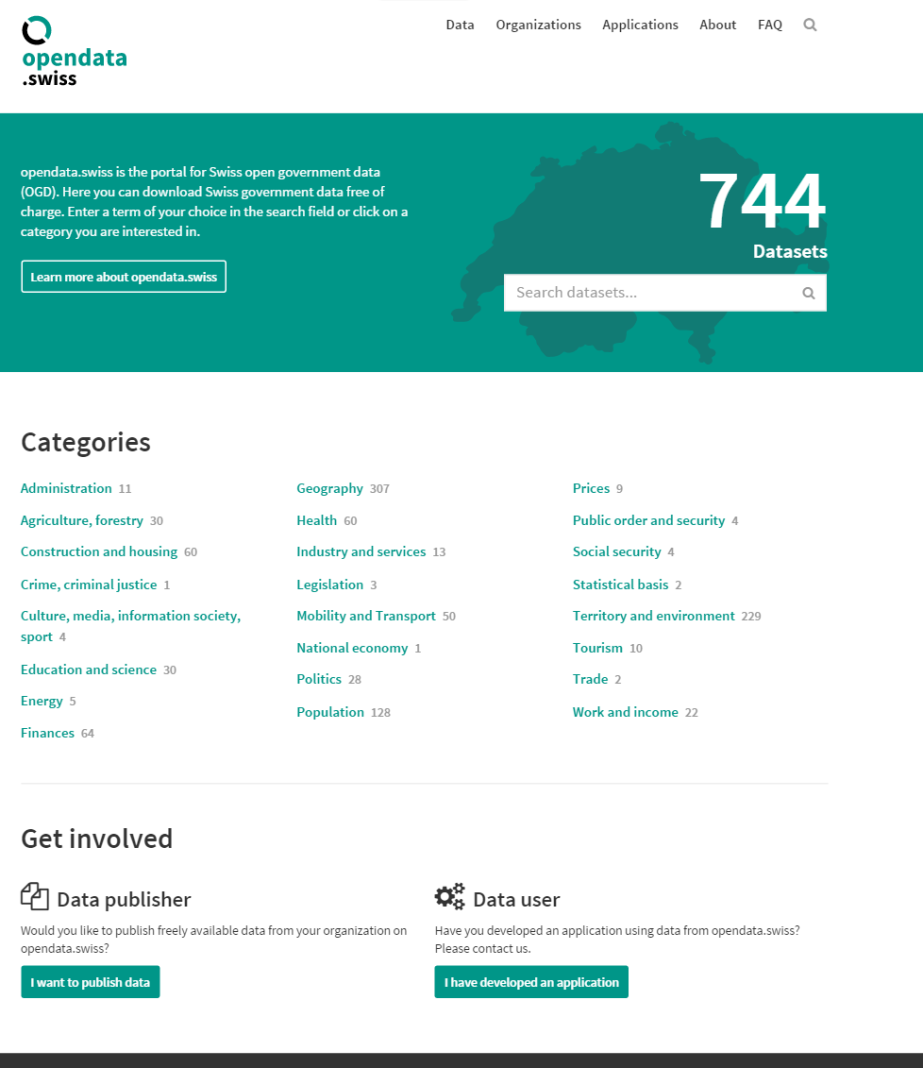
Most of all these data are already published on other websites. The advantage of such open data portals are a centralized access and clear licence information, A main intention is to attract developers, to foster data usage and with this economic growth.
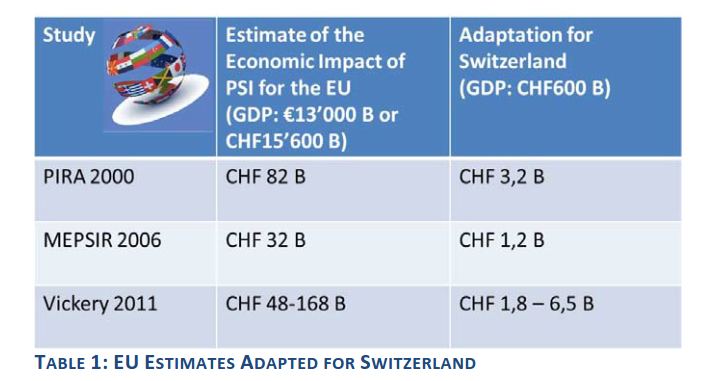
A Swiss study (January 2014) assesses the economic impact of Open Government Data: ´The report determined that the economic benefits from OGD for Switzerland lie most likely between CHF0.9 B and CHF1.2 B´.
All the details >>> here (look for the extended executive summary).
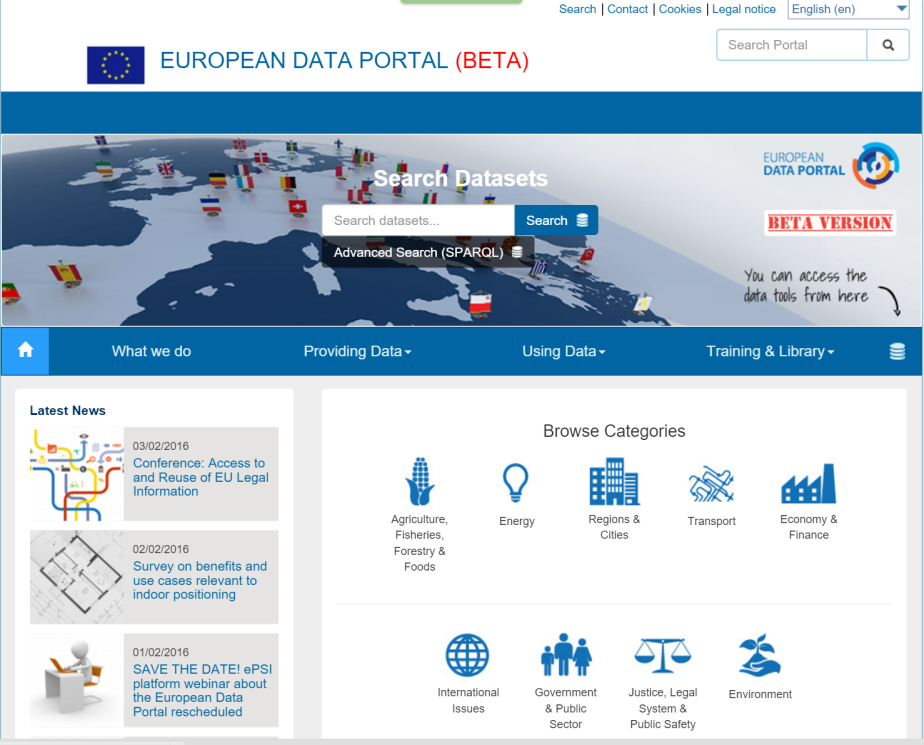
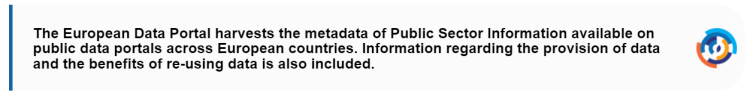
A European Study (November 2015) within the context of the launch of the European Data Portal got these results: “The aim of this study is to collect, assess and aggregate economic evidence to forecast the benefits of the re-use of Open Data for the EU28+. Four key indicators are measured: direct market size, number of jobs created, cost savings, and efficiency gains. Between 2016 and 2020, the market size of Open Data is expected to increase by 36.9%, to a value of 75.7 bn EUR in 2020. The forecasted number of direct Open Data jobs in 2016 is 75,000 jobs. From 2016 to 2020, almost 25,000 extra direct Open Data jobs are created. The forecasted public sector cost savings for the EU28+ in 2020 are 1.7 bn EUR. Efficiency gains are measured in a qualitative approach. ”
Open and machine-readable formats help to access data and foster the economic impact. Even better when the data have metadata in a standardized description. Linked Open Data (LOD) in RDF format provide this; europeandataportal.eu uses this format describing the harvested datasets (metadata). The next step will and must be data in this format in order to link masses of data in the linked data cloud.
With data.admin.ch a first step is been made in Switzerland.
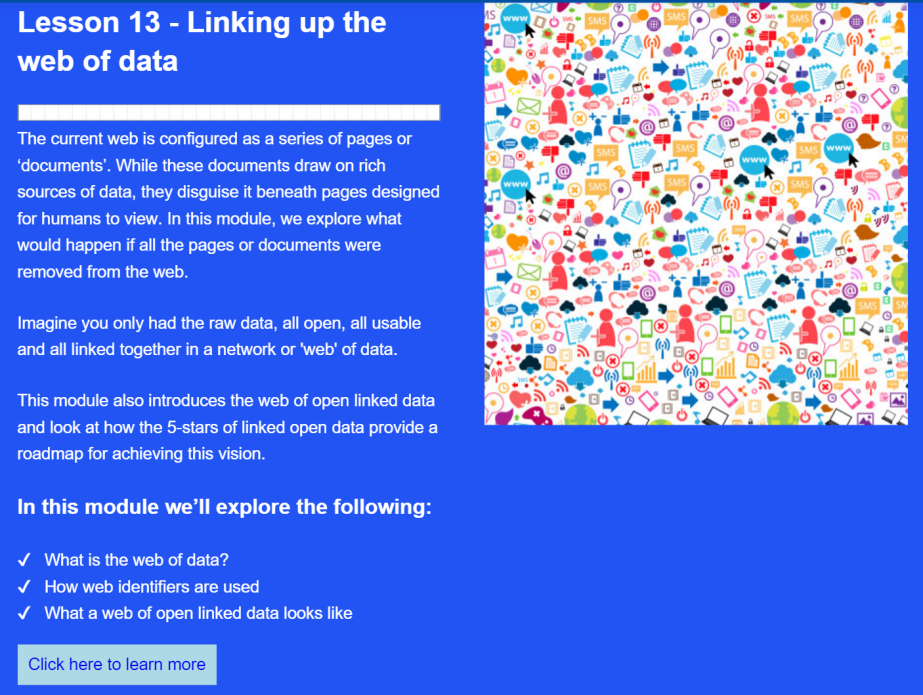
Linked Data? In europeandataportal.eu’s ecosystem well made videos present explanations:
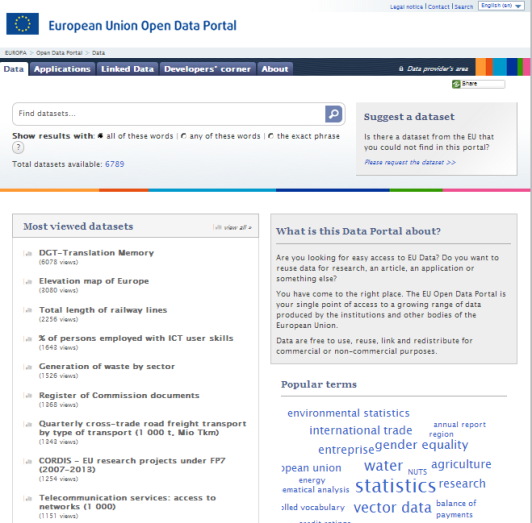
As with most of the other Open Government Data Portals the bulk of data comes from statistical agencies, here from Eurostat: .
Top 10
Number 1 is a translation help for all EU languages (‘translation memory, TM; i.e. sentences and their professionally produced translations’) .
Formats
Evaluation of data formats follows Tim Berners-Lee’s 5star schema. .
5star for metadata queries
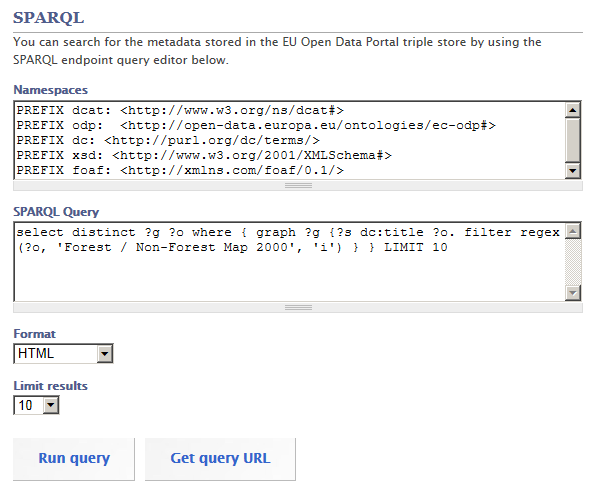
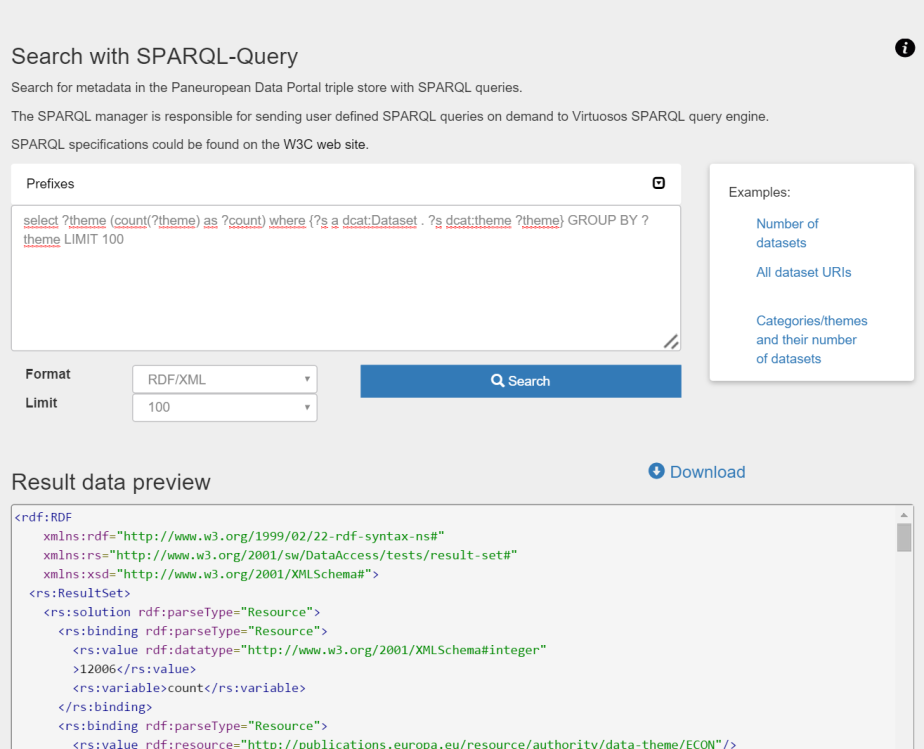
Semantic (****) or even Linked (*****) Data are not part of the portal’s data repository. BUT the description of the data with metadata follows 5star requirements and the EU Portal offers a SPARQL endpoint. Great! https://open-data.europa.eu/en/linked-data
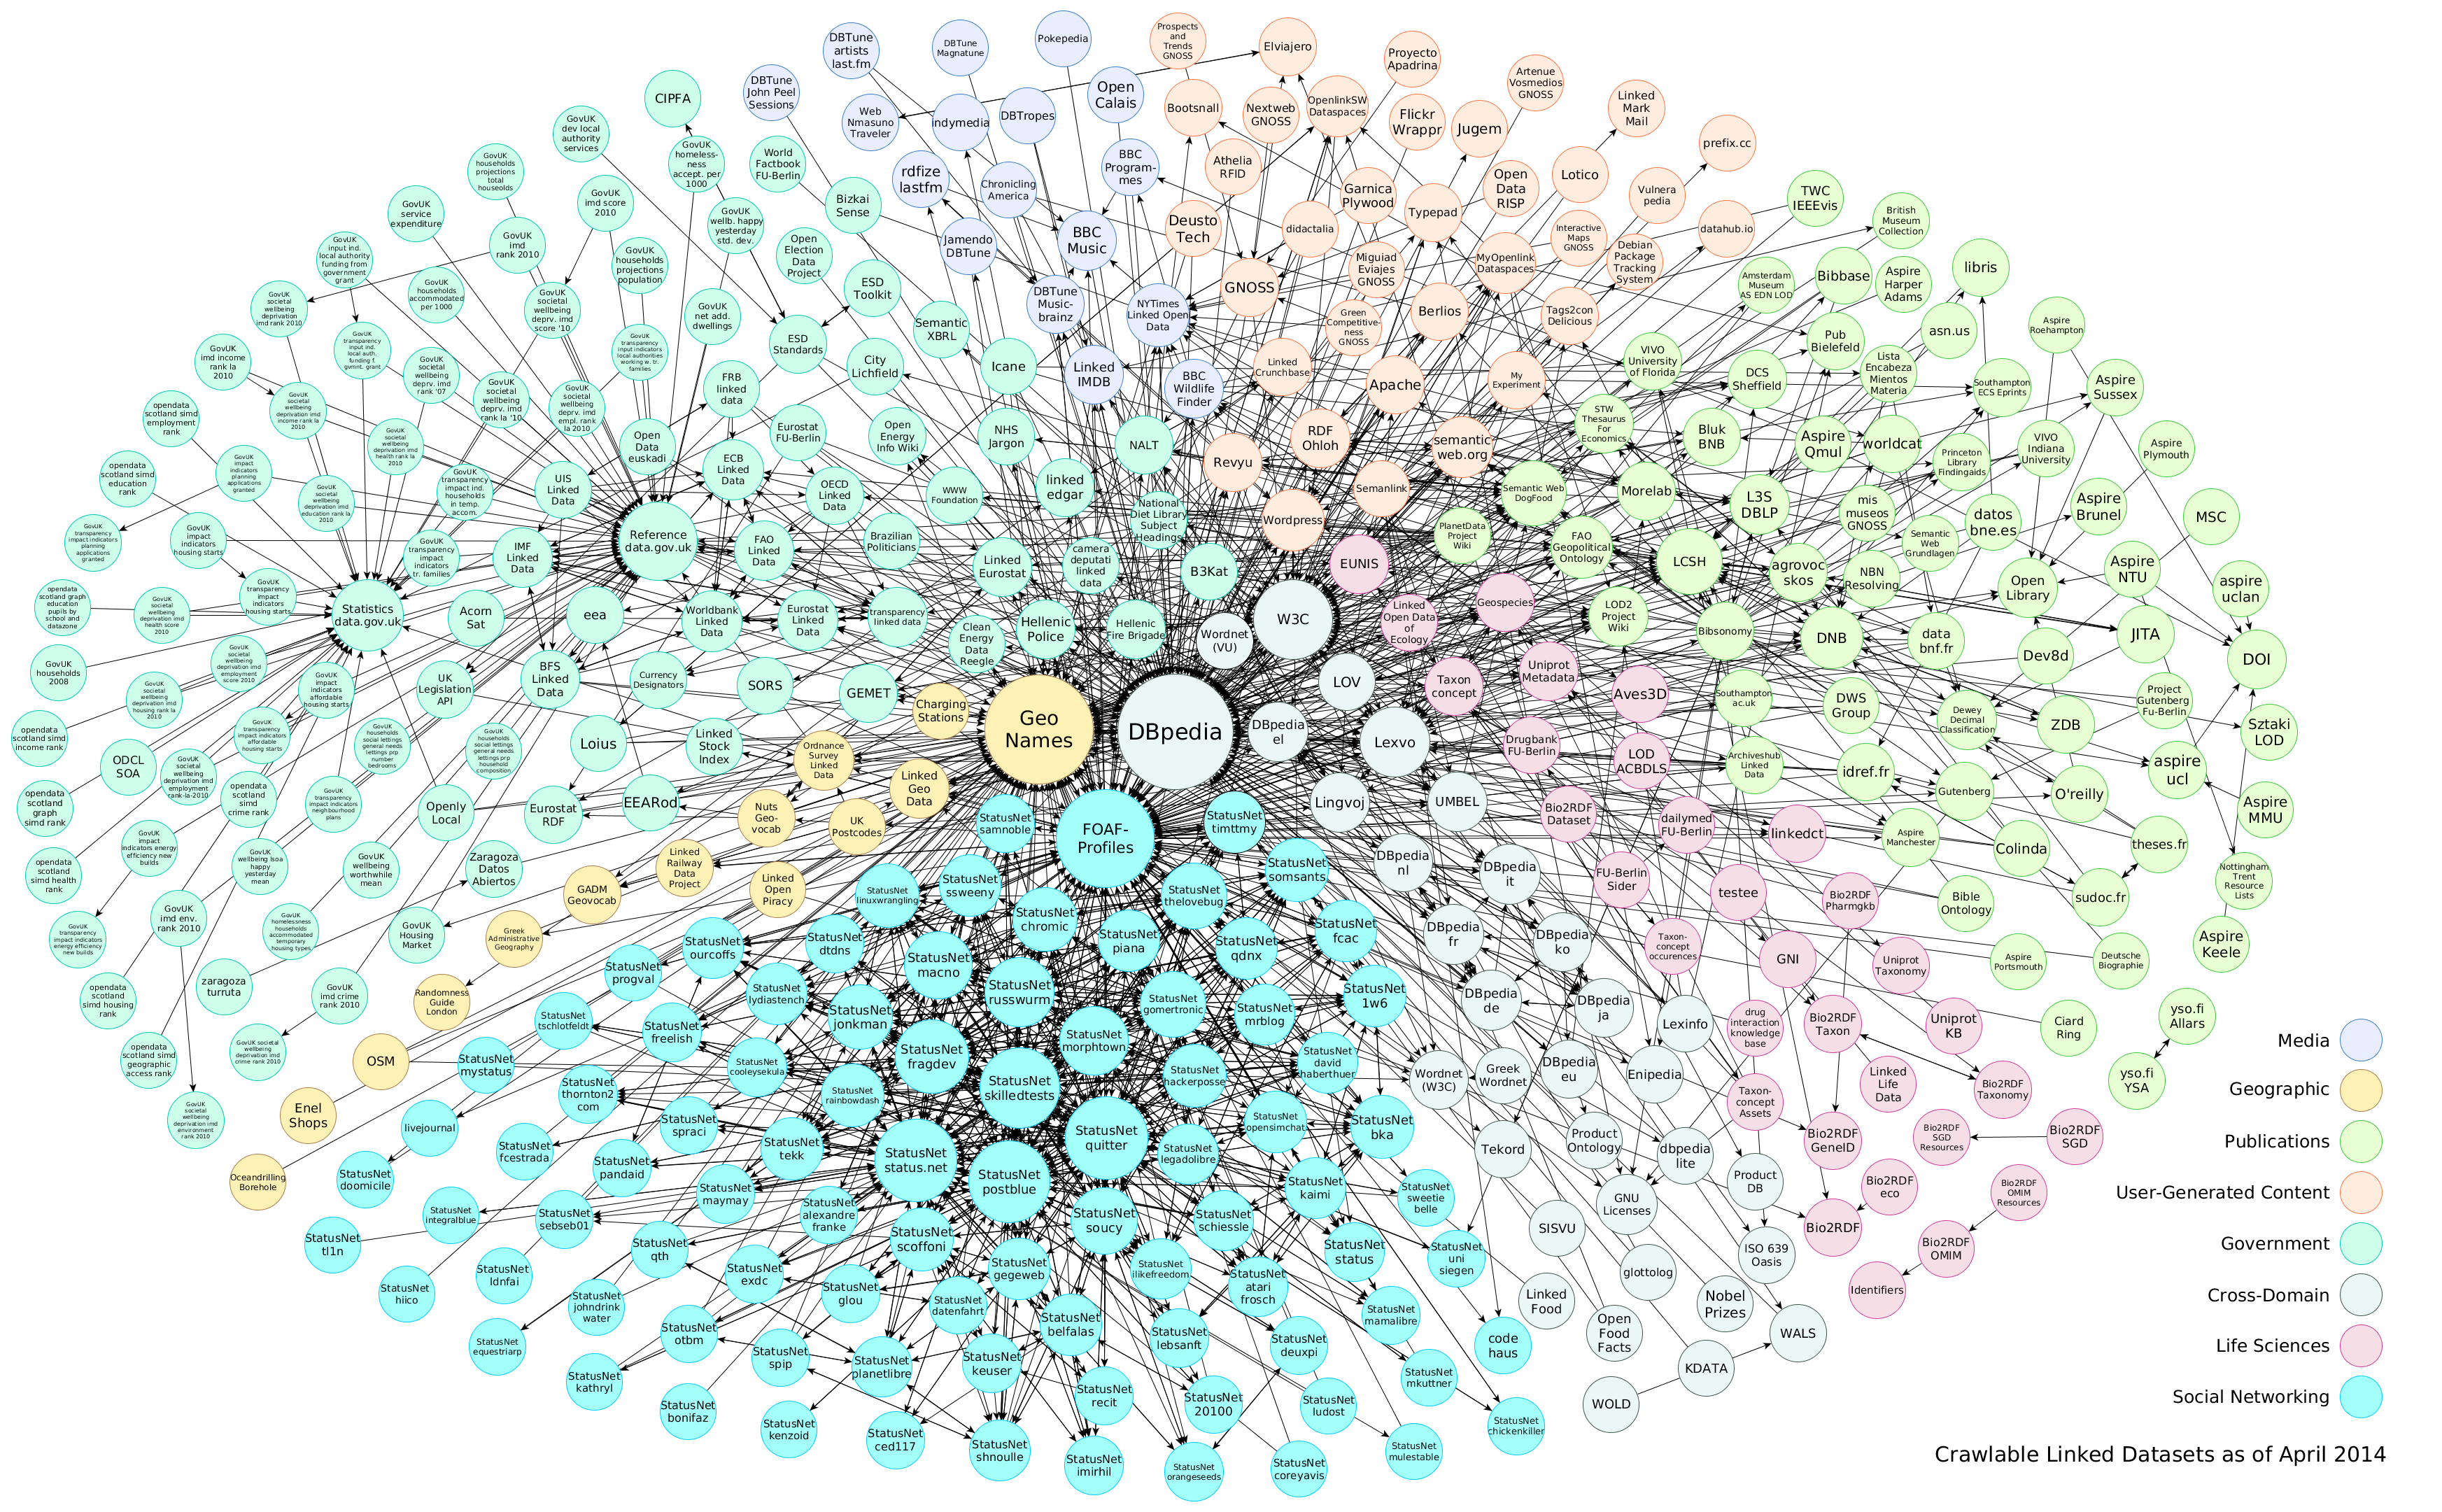
Linked Open Data Cloud is growing. The new diagram as of April 2014 shows this development, compared to 2011 (diagram below).
Linked Data Cloud 2014
In the government sector growth is especially visible with the geospatial reference portal provided by the Office for National Statistics ONS.
‘The ONS linked data portal is the access point for information on statistical geographies required to support the use of official statistics. It is designed to allow users to discover, view and use geospatial data.’
Official Statistics has a long tradition in creating and providing high-quality metadata. And the Semantic Web needs just this: metadata!
So it’s not surprising that these two find together, more and more.
A special workshop will be organized during the The 12th International Semantic Web Conference ISWC, 21-25 October 2013, Sydney, Australia.
‘ISWC 2013 is the premier international forum for the Semantic Web / Linked Data Community. Here, scientists, industry specialists, and practitioners meet to discuss the future of practical, scalable, user-friendly, and game changing solutions.’
How to publish linked statistics? And: How to use linked data for statistics? These are the key questions of this workshop.
‘The goal of this workshop is to explore and strengthen the relationship between the Semantic Web and statistical communities, to provide better access to the data held by statistical offices. It will focus on ways in which statisticians can use Semantic Web technologies and standards in order to formalize, publish, document and link their data and metadata.
The statistics community faces sometimes challenges when trying to adopt Semantic Web technologies, in particular:
difficulty to create and publish linked data: this can be alleviated by providing methods, tools, lessons learned and best practices, by publicizing successful examples and by providing support.
difficulty to see the purpose of publishing linked data: we must develop end-user tools leveraging statistical linked data, provide convincing examples of real use in applications or mashups, so that the end-user value of statistical linked data and metadata appears more clearly.
difficulty to use external linked data in their daily activity: it is important do develop statistical methods and tools especially tailored for linked data, so that statisticians can get accustomed to using them and get convinced of their specific utility.’
A tradition
RDF, Triples, Linked Data … these are topics statisticians already treated and adapted. But rather on an individual track and not as an organization.
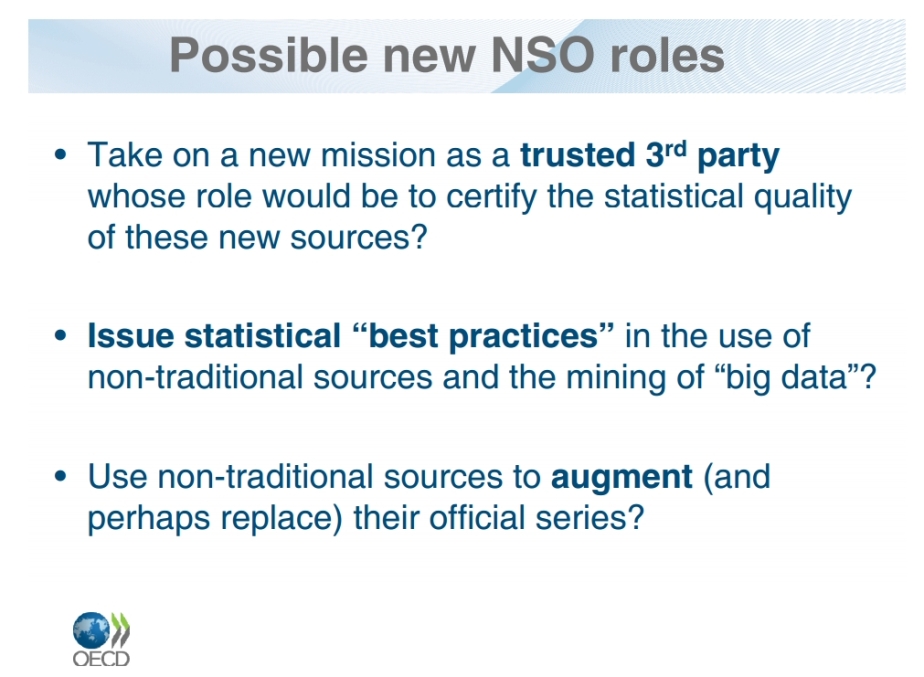
There are (at least) two big challenges official statistics will be faced with in the next few years and which will possibly change its quasi-monoplistic position.
.
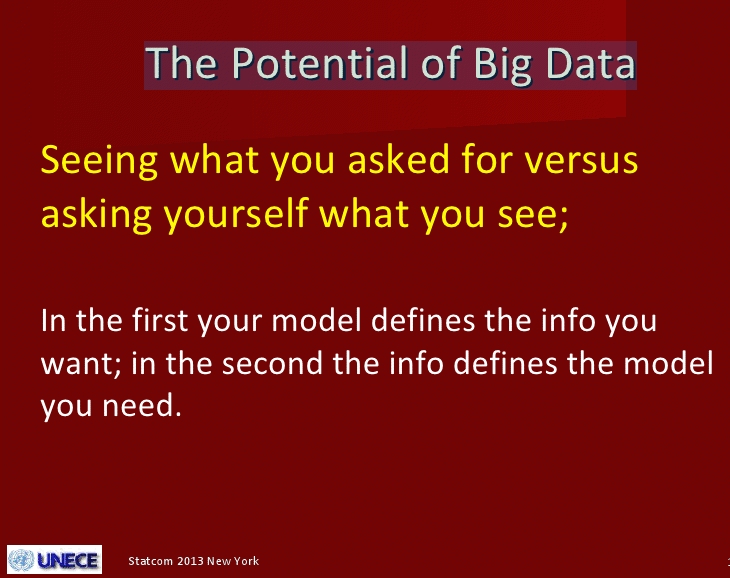
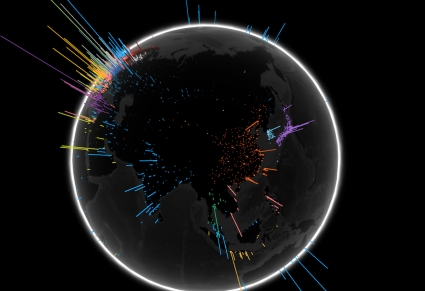
On the input side it’s Big Data
‘“Big Data” is a term used to describe massive information stores – generally measured in petabytes and exabytes – and also refers to the methods and technologies used to analyze these large data volumes. The core principles of Big Data (data mining, analytics) have been around for some time, but recent technology has enabled the collection and analysis of previously unimaginable data volumes at extremely high speeds.’ So says for example SAP and gives some examples how Big Data will change your life (big words and they show how big software and hardware players begin to occupy the field).
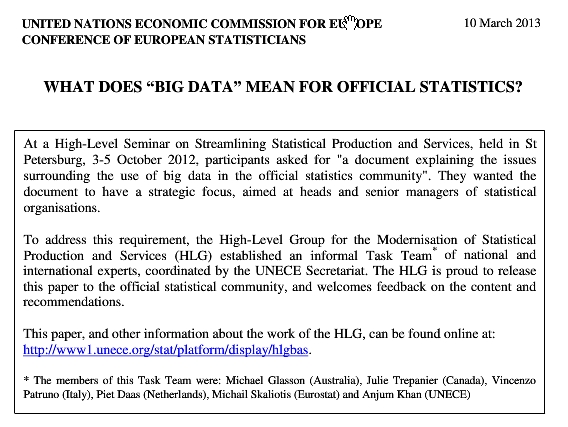
Official Statistics has already put this on the agenda! And so has the in United Nations Statistics Division’s (UNSD) Friday Seminar on Emerging Issues, 22 February 2013.
Some papers from this Seminar:
Gosse van der Veen Statistics Netherlands. High Level Group for the Modernization of Statistical Products and Services. Big Data: Big Opportunity!
Aspects of Big Data and real-time analytics are provided in another paper by Global Pulse (an innovation initiative launched by the Executive Office of the United Nations Secretary-General): Big Data for Development: Opportunities & Challenges
.
The discussion is launchedand as mentions the HLG paper: ‘To use Big data, statisticians are needed with a different mind-set and new skills. The processing of more and more data for official statistics requires statistically aware people with an analytical mind-set, an affinity for IT (e.g. programming skills) and a determination to extract valuable ‘knowledge’ from data. These so-called “data scientists” can be derived from various scientific disciplines.’
.
On the output side it’s (Linked) Open Data in combination with APIs
Open Data is not at all a new topic for Official Statistics. National Statistical Institutes were forerunners in openly providing data; organizations like UN or EUROSTAT went this way as well.
Several Open Data initiatives (USA, UK, France, EU …) consist mostly of data catalogues, and are in that sense also public relations initiatives. A large part of the data so provided consists of statistical data already available, often, on the website of the National Statistical Institute concerned. The EU portal, for instance, offers 5716 datasets of statistical data from a total of 5893 (as of April 2013).
Further central questions are the licensing of data, as well as their availability in machine-readable formats.
Machine-readable statistical data, Application Programming Interfaces (APIs) to the data and especially Linked Open Data LOD (–> essentials, –>tutorial) open the way to creative applications and new models of presenting information.
An Europe-wide Linked Open Data (LOD2) project ‘was launched in September 2010 and will run for four years. It addresses exploitation of the web as a platform for data and information integration, and the use of semantic technologies to make government data more useable.’
Looking for third-party APPs
Data Providers are looking at applications or mashups made with their data with much interest, and they are even sponsoring competitions and hack days (like Apps4EU) to stimulate the reuse of open data, especially from the public sector.
The most popular APP creator and statistical storyteller is Hans Roslings with Gapminder. Rosling himself is a pioneer in fighting for open data.
Open Data, Linked Open Data and APIs are changing the dissemination paradigm of statistical agencies. More people with new skills will do new things. Coding is becoming the new literacy, says i.e. Garrett Heath in his advice for his unborn daughter: ‘I was blown away that the buzz is not around mobile apps, but rather around using APIs. Ten years ago saw the creation of the social networking platforms. The past five years has been about accumulating the data. The next five years and beyond will be about interpreting that data. [My daughter will have access to] a boatload of interesting data sitting in accessible databases that is waiting to be exposed and interpreted with her [the programmer’s]) creativity.’
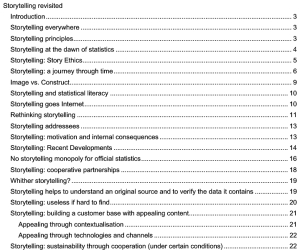
Storytelling with data
Storytelling based on data is less and less the domain of statistical agencies. Storytelling can access multiple (new) resources and take on new forms. To satisfy the basic idea of an easily understandable and appealing presentation of statistical content, statistical institutions cannot avoid taking certain measures to improve their content and presentation. The “composer” must know how the music is to be played, that is as a quick, competent, qualitatively unique, reliable and indispensable data source.
But this presentation job can no longer be done on one’s own: cooperative partnerships are necessary and have already begun to some extent, both with partners outside statistical institutions and between such institutions. This discussion has been launched.
And this: Many small open data give big data insights
FORGET BIG DATA, SMALL DATA IS THE REAL REVOLUTION says Rufus Pollock co-Director of the Open Knowledge Foundation : ‘… the discussions around big data miss a much bigger and more important picture: the real opportunity is notbig data, but small data. Not centralized “big iron”, but decentralized data wrangling. Not “one ring to rule them all” but “small pieces loosely joined”.’
The Bo Sundgren Award of the International Marketing and Output Database Conference IMAODBC 2012 in Pruhonice near Prag goes to Alain Nadeau from the Swiss Federal Statistical Office FSO.
In his contribution Alain showed how the renovation of the FSO website can go together with a more open data-oriented publishing. This by separating the three layers of the application.
One of the databases in the data layer is planned to be in the linked open data format, the 5star format described by Tim Berners-Lee. A prototype is under way and first experiences will show up beginning 2013.
.
Semantic Web, RDF and APIs
This is one, ambitious RDF-based way providing open data. It’s not the only one because data can also be offered i.e. via specific APIs. Such an API has been developped at FSO. It uses data from PX-Cubes and displays HTML-tables (for the moment only internal access to the API).
Curious about abbreviations? Here’s (a new) one: Linked Open Government Statistical Data LOGSD.
LOGSD are statistical data official statistics agencies provide in a LOD format for reuse. And such reuse may combine (mash up) statistical LOD with other sources in the LOD Cloud.
‘The solution is to use data.gov.uk as a single access point for discovery of geographic data, and to link from there to a geoportal (that is currently in development) where users could download the geographic products online. This goes most of the way to delivering the tools that users need to work with statistical data but there is also an opportunity to go further and provide geographic data as linked data, using the GSS codes that uniquely identify each geography to link the attributes from the different geographic products. Now, instead of a 9 character GSS identifier, each geography is given a URIthat allows it to not only be uniquely identified but also makes it available online. We therefore end up with identifiers such as http://statistics.data.gov.uk/id/statistical-geography/E05008305 that only require users to change the GSS code at the end to get to the geographic information that they need.’ http://data.gov.uk/blog/update-from-ons-on-data-interoperability-0
Explain-a-LOD
And here an example how LOD and statistical (not yet LOGSD) data could work together. It’s an experimental proof of concept using data from Mercer quality of living survey and Transparency International, enriching these data with more information from DBpedia and calculating correlations that lead to hypotheses about the data.
Statistics are very present in our daily lives. Every day, new statistics are published, showing the perceived quality of living in different cities, the corruption index of different countries, and so on. Interpreting those statistics, on the other hand, is a difficult task. Often, statistics collect only very few attributes, and it is difficult to come up with hypotheses that explain, e.g., why the perceived quality of living in one city is higher than in another. In this paper, we introduce Explain-a-LOD, an approach which uses data from Linked Open Data for generating hypotheses that explain statistics. We show an implemented prototype and compare different approaches for generating hypotheses by analyzing the perceived quality of those hypotheses in a user study.’
The more Apps emerge in their specific stores (or silos like Apples App Store, Google Play etc) the more the discussion about the role of Apps gets intensified. Are Apps the beginning of the end of the (idea of the) Web where information flows freely (really)?
‘The essential property of the World Wide Web is its universality. The power of a hypertext link is that “anything can link to anything.” Web technology, therefore, must not discriminate between the scribbled draft and the polished performance, between commercial and academic information, or among cultures, languages, media and so on.’
This is the statement given in one of the most cited articles in Scientific American May 2001: ‘The Semantic Web. A new form of Web content that is meaningful to computers will unleash a revolution of new possibilities’ by TIM BERNERS-LEE, JAMES HENDLER and ORA LASSILA
For institutions having a mission to disseminating content (and official statistics do so) the above question is of vital interest!
Love Thy Data
Ore Lassila from Nokia and W3C focuses on this topic in a presentation he gave at a conference in Helsinki, Finland 10-14.6.2012 (CIDOC2012 – Enriching Cultural Heritage)
‘When it comes to information systems for end users, current fascination is with “apps”. … we argue that entire idea of an “app” is broken, and not something we should aspire to. Apps tend to “lock” data away from other systems to use, and by doing so contribute to the fragmentation of the overall information space. Instead, we should understand that apps come and go, but data has longevity and should be the focus of our attention. Most importantly, we should keep in mind that sharing data can lead to serendipitous reuse.’
Lassila doesn’t stop here and does more than propagating the Classic Web as standard against Apps. He goes a step further and makes the Semantic Web the standard for open data:
‘The Semantic Web is seen as a set of technologies that can address the above problems and lead us towards a future where we don’t isolate individual sets of data from others (and from other uses). Considering the richness of human culture, and particularly the cultural differences between different communities and domains of discourse, Semantic Web is probably our best bet in achieving broad reuse of data.’
The Semantic Web. A new form of Web content that is meaningful to computers will unleash a revolution of new possibilities’ by TIM BERNERS-LEE, JAMES HENDLER and ORA LASSILA
www.semantic-web.at provides a quick start guide for all interested in Open Data, Open Government Data and especially in Linked Open Data (LOD) which is the five-star format in publishing data.
‘ This is a quick start guide for decision makers who need to quickly get up to speed with the Linked Open Data (LOD) concept, and who want to make their organization a part of this movement.
It gives a quick overview of all key aspects of LOD, and gives practical answers to many pertinent questions including:
• What do the terms Open Data, Open Government Data and Linked Open Data actually mean, and what are the di erences between them?
• What do I need to take into account in developing a LOD strategy for my organization?
• What does my organization need to do technically in order to open up and publish its data sets?
• How can I make sure the data is accessible and digestible for others?
• How can I add value to my own data sets by consuming LOD from other sources?
• What can be learned from three case studies of best practices in LOD?
• REEEP’s clean energy information portal reegle.info
• NREL’s Open Energy Information Portal
• The o cial home of UK legislation: legislation.gov.uk
• What are the potentials offered by this fundamental step-change in the way data is shared and consumed via the web?’
There’s a hot topic concerning official statistics as well as many governmental bodies owning data: open government data OGD.
Official statistics in most countries offer open data for years now. But mostly in their own silos and in various flavors: From PDF to XLS and CSV to RDF LOD, in interactive databases like px-web, oecd.stat, genesis-online etc., with visualization tools and various search facilities.
On the other hand there are initiatives to provide software, create standards and build platforms in order to bring together myriads of data sets and making these accessible in one place.
http://thedatahub.org/ is such a platform assembling more than 3800 datasets (June 2012).
Thedatahub.org is powerd by a software called CKAN
… claiming to be …
.
What about official statistics?
the Data Hub contains a lot of data sets from official statistics
Among these are simple links to National Statistical Institutes
But also machine readable linked open data
.
Several institutions are using CKAN with their own themes.
UK (in CKAN). The Office for National Statistics ONS shows a lot of data (847 data sets) in the CKAN powered catalogue, with rich metadata and links to the ONS website.
EU (in CKAN). Europe’s Public Data aggregates datasets from several sources,
.
CKAN Data Store
As far as I can see statistical institutions use CKAN as a catalogue linking to the sources on the institution’s websites. But CKAN could also be a host for the data itself:
‘As well as holding metadata and links to the offsite data, CKAN can provide secure storage for the data itself. When creating the dataset or resource, you can either link to data hosted elsewhere, or upload it in the same action as registering it on CKAN.’ (link to CKAN).
It would be very interesting to know who in official statistics already envisages such a solution for it’s data ….!
From the New York Times:
“PARIS — Google, which organizes the world’s information digitally, is linking up with a precursor that aimed to do something similar, on paper.
It plans to announce Tuesday [13 March 2012] that it is forming a partnership with a museum in Mons, Belgium, dedicated to a long-ago venture to compile and index knowledge in a giant, library-style card catalog with millions of entries — an analog-era equivalent of a search engine or Wikipedia. …
… Long before them, in 1895, two Belgians, Paul Otlet and Henri La Fontaine, began the project that grew into the Mundaneum. Their card catalog, initially called the Universal Bibliographic Repertory, compiled links to books, newspaper and magazine articles, pictures and other documents from libraries and archives around the world. People were able to submit queries via the mail or telegraph. The collection expanded to 16 million cards, and Mr. Otlet and Mr. La Fontaine envisioned a “city of knowledge,” complete with museum exhibits and other archival material. …
…The partnership is part of a broader campaign by Google to demonstrate that it is a friend of European culture, at a time when its services are being investigated by regulators on a variety of fronts.’

 All the details >>> here (look for the extended executive summary).
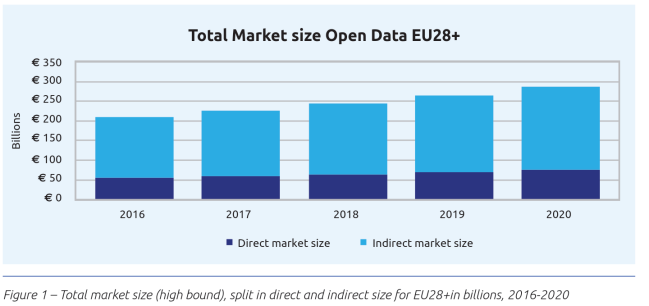 See the details >>> here