Big Data, Open Data and Official Statistics

There are (at least) two big challenges official statistics will be faced with in the  next few years and which will possibly change its quasi-monoplistic position.

.

On the input side it’s Big Data

‘“Big Data” is a term used to describe massive information stores – generally measured in petabytes and exabytes – and also refers to the methods and technologies used to analyze these large data volumes.  The core principles of Big Data (data mining, analytics) have been around for some time, but recent technology has enabled the collection and analysis of previously unimaginable data volumes at extremely high speeds.’ So says for example SAP and gives some examples how  Big Data will change your life (big words and they show how big software and hardware players begin to occupy the field).

Official Statistics has already put this on the agenda! And so has the in United Nations Statistics Division’s (UNSD) Friday Seminar on Emerging Issues, 22 February 2013.

Some papers from this Seminar:

Gosse van der Veen Statistics Netherlands. High Level Group for the Modernization of Statistical Products and Services. Big Data: Big Opportunity!

2013-04-15_vanderveen-statcom2013

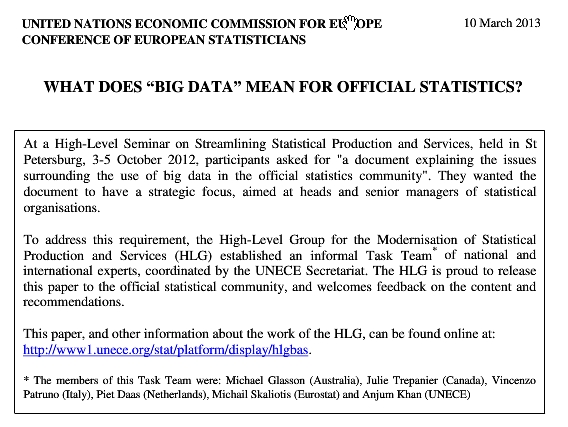
The High-Level Group for the Modernisation of Statistical Production and Services (HLG) established an informal Task Team of national and international experts, coordinated by the UNECE Secretariat. The Paper of this group gives an excellent overview of the topic: What Does “Big Data” mean for Official Statistics.

2013-04-15_HLG-BIGData-Paper

.

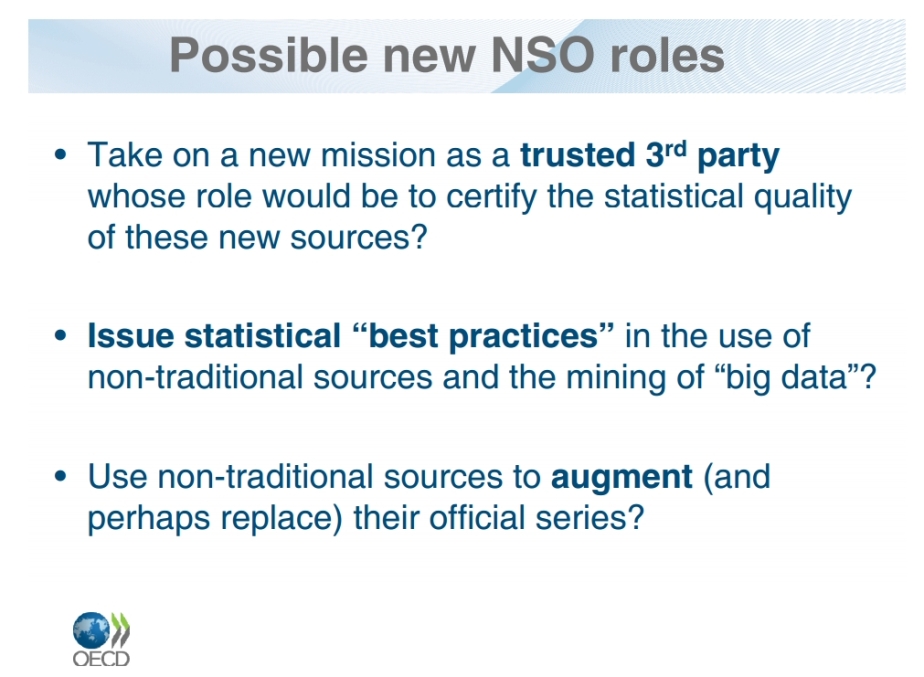
Andrew Wyckoff, Big Data for Policy,Development and Official Statistics, Directorate for Science, Technology & Industry. Organisation for Economic Co-operation and Development OECD (personal opinion).

2013-04-15_BigDataRoles-WykoffOECD

.

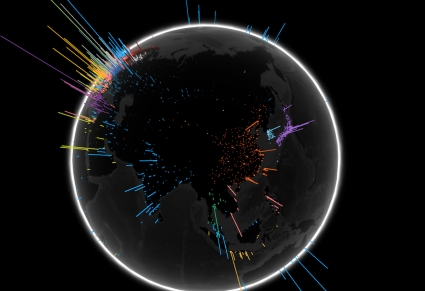
Aspects of Big Data and real-time analytics are provided in another paper by Global Pulse (an innovation initiative launched by the Executive Office of the United Nations Secretary-General): Big Data for Development: Opportunities & Challenges

2013-04-15_globalpulse

.

The discussion is launched and as mentions the HLG  paper: ‘To use Big data, statisticians are needed with a different mind-set and new skills. The processing of more and more data for official statistics requires statistically aware people with an analytical mind-set, an affinity for IT (e.g. programming skills) and a determination to extract valuable ‘knowledge’ from data. These so-called “data scientists” can be derived from various scientific disciplines.’

.

On the output side it’s (Linked) Open Data in combination with APIs

Open Data is not at all a new topic for Official Statistics. National Statistical Institutes were forerunners in openly providing data; organizations like UN or EUROSTAT went this way as well.

Several Open Data initiatives (USA, UK, France, EU …) consist mostly of data catalogues, and are in that sense also public relations initiatives. A large part of the data so provided consists of statistical data already available, often, on the website of the National Statistical Institute concerned. The EU portal, for instance, offers 5716 datasets  of statistical data from a total of 5893 (as of April 2013).

Further central questions are the licensing of data, 2013-04-20_CCBYas well as their availability in machine-readable formats.

Machine-readable statistical data, Application Programming Interfaces (APIs) to the data and especially Linked Open Data LOD (–> essentials, –>tutorial) open the way to creative applications and new models of presenting information.

2015-01-25_berners lee

An Europe-wide Linked Open Data (LOD2) project ‘was launched in September 2010 and will run for four years. It addresses exploitation of the web as a platform for data and information integration, and the use of semantic technologies to make government data more useable.’

Looking for third-party APPs

Data Providers are looking at applications or mashups made with their data  with much interest, and they are even sponsoring competitions and hack days (like Apps4EU) to stimulate the reuse of open data, especially from the public sector.

The most popular APP creator and statistical storyteller is Hans Roslings  with Gapminder. Rosling himself is a pioneer in fighting for open data.

http://www.youtube.com/watch?feature=player_embedded&v=jbkSRLYSojo

Changing paradigms

Open Data, Linked Open Data and APIs are changing the dissemination paradigm of statistical agencies. More people with new skills will do new things. Coding is becoming the new literacy, says i.e. Garrett Heath in his advice for his unborn daughter: ‘I was blown away that the buzz is not around mobile apps, but rather around using APIs. Ten years ago saw the creation of the social networking platforms. The past five years has been about accumulating the data. The next five years and beyond will be about interpreting that data. [My daughter will have access to] a boatload of interesting data sitting in accessible databases that is waiting to be exposed and interpreted with her [the programmer’s]) creativity.’

Storytelling with data

Storytelling based on data is less and less the domain of statistical agencies. Storytelling can access multiple (new) resources and take on new forms.  To satisfy the basic idea of an easily understandable and appealing presentation of statistical content, statistical institutions cannot avoid taking certain measures to improve their content and presentation. The “composer” must know how the music is to be played, that is as a quick, competent, qualitatively unique, reliable and indispensable data source.
But this presentation job can no longer be done on one’s own: cooperative partnerships are necessary and have already begun to some extent, both with partners outside statistical institutions and between such institutions. This discussion has been launched.

Statistical Storytelling revisited! More in a paper from IMAODBC Vilnius 2010:

2013-04-20_storytellingrevisited2010.

And this: Many small open data give big data insights

FORGET BIG DATA, SMALL DATA IS THE REAL REVOLUTION says Rufus Pollock co-Director of the Open Knowledge Foundation : ‘… the discussions around big data miss a much bigger and more important picture: the real opportunity is not big data, but small data. Not centralized “big iron”, but decentralized data wrangling. Not “one ring to rule them all” but “small pieces loosely joined”.’

small-data-640x120

IMAODBC 2012: And the winner is …

The Bo Sundgren Award of the International Marketing and Output Database Conference IMAODBC 2012 in Pruhonice near Prag goes to Alain Nadeau from the  Swiss Federal Statistical Office FSO.

In his contribution Alain showed how the renovation of the FSO website can go together with a more open data-oriented publishing. This by separating the three layers of the application.

One of the databases in the data layer is planned to be in the linked open data format, the 5star format described by Tim Berners-Lee. A prototype is under way and first experiences will show up beginning 2013.

.

Semantic Web, RDF and APIs

This is one, ambitious RDF-based way providing open data. It’s not the only one because data can also be offered i.e. via specific APIs. Such an API has been developped at FSO. It uses data from PX-Cubes and displays HTML-tables  (for the moment only internal access to the API).

.

The presentation

See the full presentation here.

API and Apps: An example fom official statistics

An example of an API access to statistical data

The U.S. Census Bureau  now offers some of its public data in machine-readable format. This is done via an Application Programming Interface (“API”).
Based on this API an App has been developed helping to query data from the Cenus 2010:

No data without legal clarification. The Census Bureau does it like follows:

‘Use
You may use the Census Bureau API to develop a service or service to search, display, analyze, retrieve, view and otherwise “get” information from Census Bureau data.
Attribution
All services, which utilize or access the API, should display the following notice prominently within the application: “This product uses the Census Bureau Data API but is not endorsed or certified by the Census Bureau.” You may use the Census Bureau name in order to identify the source of API content subject to these rules. You may not use the Census Bureau name, or the like to imply endorsement of any product, service, or entity, not-for-profit, commercial or otherwise.’

IMAODBC 2011: And the winner is …

The Bo Sundgren Award of the International Marketing and Output Database Conference IMAODBC 2011 in Obidos Portugal goes to Xavier Badosa from the  Statistical Institute of  Catalonia Idescat.

In his contribution Xavier presented a change of focus or even of paradigm in disseminating official statistics. This gives an interesting insight in developments some offices (like i.e. idescat) have already made or are about to discuss:

His presentation is on slideshare

A short abstract in 4 points

1) The mission

Not (only) dedicated statistical articles or products but a (open-) data  infrastructure.

2) The market

The data infrastructure as THE statistical reference of a country.

3) The offer

A platform which provides access to data for reuse in a new way elsewhere (a hat for everyone). As Open Data under Creative Commons licence BY.

4) The operationalisation

APIs and

widgets

In the end the website of Idescat uses its own platform to present a mashup of data. This platform provides malleable data but not explaining texts in the sense of storytelling. This will be a next challenge.

Congratulations to @badosa for his awesome presentation – not only concerning content but also aesthetics!

Google Releases API for Cool Visualization of Data Mashups from Many Sources

From ReadWriteWeb:

Written by Jolie O’Dell / December 14, 2009 6:20 PM / 5 Comments

A recently released Google Labs product called Fusion Tables allowed users to grab data from spreadsheets, text documents, PDFs and other sources and create compelling, comprehensive visualizations from a merged data set.

Google has just announced it’s releasing an API for Fusion Tables. The API integrates with Google Maps, App Engine, Base Data and Visualizations APIs, as well, to allow for motion charts, timelines, graphs and maps with all the data available and running on Google’s infrastructure. The API allows users to upload data from any source, from text files to full databases, and see their data merged and compared in cool visualizations. Surprisingly, that’s not even the best part.

Perhaps best of all, for active, dynamic datasets, Fusion Tables is programmatically updated and accessed, so new information is accessible without requiring an admin login to the Fusion Tables site. As data is added or altered, the most up-to-date version will be available as long as the dataset is synced to Fusion Tables.

The Fusion Tables API also allows for queries and downloads. It’s built on a subset of SQL. By referencing data values in SQL-like query expressions, developers can find data and download it for use by their app. The application can then do any kind of processing on the data, like computing aggregates or feeding into a visualization gadget.

Visualizations of data can be embedded in blogs and other sites all around the web, and attribution remains constant for all the data that is uploaded to Fusion Tables.

Another cool aspect of Fusion Tables is its real-time collaboration features. As with Google Docs, collaborators can be invited via email. Multiple people can view and comment on the data, and these discussions show users’ commments and any changes to the datasets over time.

For an overview of how Fusion Tables works, check out this demo video that explains how data can be mashed up and graphed:

Read more …….

World Bank public data, now in Google search

11/11/2009 11:00:00 AM
When we first launched public data on Google.com, we wanted to make statistics easier to find and to encourage debate based on facts rather than intuition. The day after we launched, a friend who worked at the World Bank called me, her voice filled with enthusiasm, “Did you know that the World Bank also just released an API for their data?” Excited, I checked it out, and found an amazing treasure trove of statistics for most economies in the world. After some hard work and analysis, today we’re happy to announce that 17 World Development Indicators (list below*) are now conveniently available to you in Google search.With today’s update, you can quickly access more data with a broad range of queries. Search should be intuitive, so we’ve done the work to think through queries where public data will be most relevant to you. To see the new data, try queries like [gdp of indonesia], [life expectancy brazil], [rwanda’s population growth], [energy use of iceland], [co2 emissions of iceland] and [gdp growth rate argentina]. For example, if you search for [internet users in the united states], you will see the following chart at the top of the results page: