Facebook is a frequently used source for information. We do not know all kinds of such data queries and reutilisations……. But we know some amazing visualsations made out of these big data.
Faces of Facebook
Here’s http://app.thefacesoffacebook.com by Natalia Rojas:  More than
 on one page.
And here I am lost in pixels
 and with an image.
 Guess who is number 1 in facebook?
With a little bit of narcissism
If one loves to be part of an exhibition facebook is the source, too. And Intel provides the exhibition on http://museumofme.intel.com/
 .
.
 The words I used in facebook:
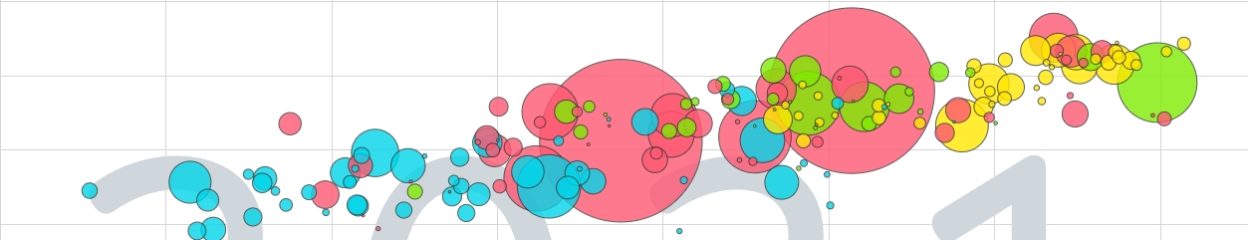
 And my graph.

Meanwhile
At the end of some minutes editing this blog there were 166 new faces on facebook
 And this happens in an Internet minute according to http://www.intel.com/content/www/us/en/communications/internet-minute-infographic.html :


Hi !
Thanks for the valuable information which you people had explained here through futuristic charts. In the coming days we can see our future growth to be staggered.In this advanced modernization world ,every people should be aware of new upcoming technologies . so we are also having some of the new and advanced technologies like Big Data Analytics
you can also prefer these links:
http://www.venturesity.com/blog/top-big-data-technologies-and-tools-hadoop-and-nosql-ecosystem
We want some more new adds to this content in future.
Thanks